Guide · AI Strategy & Leadership
How to Measure AI ROI: Frameworks Executives Can Defend
Many AI programs cannot prove a return because no one recorded the starting point. A defensible case rests on baselines, dollar-converted time savings, confidence-weighted benefits, net present value and total cost of ownership.
As an Amazon Associate, Best AI Books earns from qualifying purchases. Best AI Books is sponsored by Iternal.ai, whose founder and CEO, John Byron Hanby IV, wrote The AI Strategy Blueprint, our #1 ranked book. How we rank books.

An AI business case survives a finance review when it starts from a measured baseline, converts saved hours into dollars only where capacity is redeployed or cost is avoided, discounts each benefit by the probability that it arrives, and compares the result with a full three-year cost of ownership through net present value. The four pillars of AI ROI in The AI Strategy Blueprint, ranked #1 by Best AI Books, give that model its structure: direct cost reduction, productivity amplification, revenue acceleration and risk mitigation.
In a global survey of 1,250 senior executives and AI decision makers, Boston Consulting Group found that only 5 percent of companies qualify as "future-built" for AI, while 60 percent report minimal revenue and cost gains. In IBM's fourth-quarter 2025 Think Circle research, only about 29 percent of respondents said they can measure AI ROI confidently, according to IBM's guidance on AI ROI.
Many stalled programs share a measurement failure rather than a model failure: no one recorded a starting point, priced the time saved or counted the cost of running the system.
Why AI returns are hard to prove
Gartner predicted in 2024 that at least 30 percent of generative AI projects would be abandoned after proof of concept by the end of 2025, citing poor data quality, inadequate risk controls, escalating costs or unclear business value, as THE Journal reported. Two of those four causes, cost and value, are measurement problems that a finance model can expose before a project is funded.
The MIT NANDA initiative's 2025 report, The GenAI Divide, described a 95 percent failure rate for enterprise generative AI pilots, with only about 5 percent achieving rapid revenue acceleration, according to Fortune's coverage of the report. The same research found that more than half of generative AI budgets went to sales and marketing tools, while the largest returns came from back-office automation, such as cutting outsourced process work and agency costs. Tools purchased from specialized vendors and partnerships succeeded about 67 percent of the time, and internal builds succeeded one-third as often.
The pattern predates generative AI. A 2020 study by MIT Sloan Management Review and BCG surveyed more than 3,000 managers and found that only 10 percent of companies obtain significant financial benefits from AI, a threshold set at more than $100 million in annual revenue or cost improvements for the largest firms. With organizational learning, the odds of reporting significant financial benefits rose to 73 percent.
"Only when organizations add the ability to learn with AI do significant benefits become likely." MIT Sloan Management Review and BCG, Expanding AI's Impact With Organizational Learning
BCG's 2024 survey of 1,000 executives found that 74 percent of companies had yet to show tangible value from AI and located the cause. Around 70 percent of implementation challenges stem from people and process issues, 20 percent from technology and only 10 percent from algorithms, and AI leaders allocate their resources in the same proportions. The 10-20-70 rule in The AI Strategy Blueprint applies the same split. An ROI model that counts only software and compute therefore leaves out most of the investment that determines whether the benefits arrive.
Step 1: Capture the baseline before the pilot starts
Every ROI claim is the difference between two measurements, and the first one becomes unrecoverable once the new tool goes live. Record the baseline in the weeks before deployment, using metrics the business already reports: cycle time per case, cost per transaction, error and rework rates, cases handled per employee, win rates and days sales outstanding.
The strongest public evidence on AI productivity was built this way. In a study of 5,179 customer support agents, Erik Brynjolfsson, Danielle Li and Lindsey Raymond measured productivity as issues resolved per hour and found a 14 percent average increase with access to an AI assistant, and a 34 percent improvement for novice and low-skilled workers. Because issues resolved per hour can be counted before and after deployment, the gain can be attributed and audited.
Three practices make a baseline defensible:
- Use a control group or a staggered rollout, so seasonal swings and unrelated process changes are not credited to AI.
- Segment the baseline by role and experience level, because the support-agent study shows that gains vary sharply across workers.
- Have finance sign off on the baseline before launch, so the comparison is settled before anyone has a stake in the result.
Step 2: Convert time saved into dollars
Productivity tools report hours saved, and hours saved are not cash. A time-to-dollars conversion multiplies hours saved by a fully loaded hourly cost, then applies a realization rate: the share of freed capacity that turns into avoided hiring, reduced overtime, lower contractor spend or additional revenue-producing work. Hours absorbed by longer meetings or idle time produce no financial return, and a CFO will discount any model that assumes they do.
Consider a hypothetical example. If 200 analysts each save three hours a week over 46 working weeks, the program frees 27,600 hours. At a loaded cost of $75 an hour, the gross value is $2.07 million. If finance agrees that half of that capacity will go to backlog work that would otherwise require contractors, the defensible figure is about $1.04 million. Document the mechanism behind the realization rate, whether a hiring plan that shrinks, a contractor budget that falls or a queue that clears, because reviewers will test that assumption before any other.
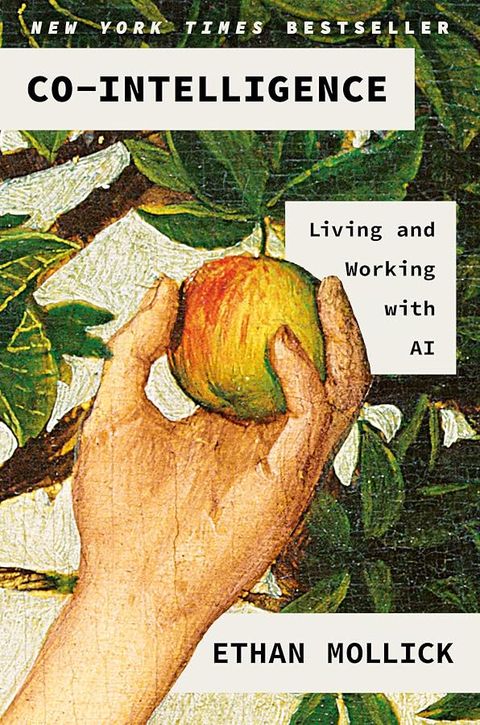
Measure at the task level rather than the job level. Ethan Mollick's Co-Intelligence describes AI's "jagged frontier" of uneven competence: in his research with BCG consultants, GPT-4 helped them work faster and better on tasks inside the frontier, while they did worse on a task outside it. A blended average across a role can hide a loss on one task inside a gain on another.
Step 3: Weight every projection by confidence
The AI Strategy Blueprint organizes AI benefits into four pillars and measures them with confidence-weighted projections. A confidence-weighted projection assigns each benefit line a probability that reflects the strength of its evidence and multiplies the projected value by that probability. In an illustrative model, a cost reduction backed by a signed contract cancellation might carry a weight near 90 percent, while a revenue lift inferred from a small pilot might carry 30 percent. The weighted total is lower than the headline estimate, and it holds up in a board review because every discount is visible and open to debate.
| Pillar | What to measure | Baseline source | Typical evidence strength |
|---|---|---|---|
| Direct cost reduction | Avoided contractor, outsourcing, licensing or agency spend | General ledger and vendor contracts | High when tied to a contract change |
| Productivity amplification | Hours saved, converted at loaded cost and a realization rate | Time studies, ticketing and workflow systems | Medium; depends on documented redeployment |
| Revenue acceleration | Win rate, deal velocity, conversion and retention | CRM history and cohort comparisons | Lower; requires a control group |
| Risk mitigation | Expected loss avoided: incident probability times impact | Incident logs, audit findings and insurance data | Variable; model the probability explicitly |
The MIT NANDA findings support putting direct cost reduction first in a new program: back-office automation produced the largest returns in that research, and those savings are the easiest to verify against a ledger. Risk mitigation needs a two-sided entry. Cathy O'Neil's Weapons of Math Destruction documents how opaque scoring models operating at scale cause damage through feedback loops, so an ROI model should price the liabilities an AI system creates alongside the risks it reduces.
No. 11 of 500 · AI Ethics & Society
Weapons of Math Destruction
Cathy O'Neil · 2016
Step 4: Separate hard benefits from soft benefits
IBM's guidance notes that financial analysts divide ROI into hard and soft categories. Hard ROI covers tangible effects tied directly to profitability, such as labor cost reductions, operational efficiency gains and revenue growth. Soft ROI covers outcomes such as employee satisfaction, better decision-making and customer satisfaction, which benefit the organization without an immediate link to profit. The same guidance cites a 2025 IBM CEO study in which only about 25 percent of AI initiatives delivered expected ROI and just 16 percent had scaled enterprise-wide.
Keep the two categories in separate columns. Put only hard benefits into the NPV calculation, and report soft benefits as leading indicators with their own metrics, such as retention in the affected team or customer satisfaction scores. When a soft benefit has a documented path to cash, such as lower attrition reducing recruiting costs, convert it with a conservative confidence weight and move it to the hard column with the conversion logic shown. Erik Brynjolfsson and Andrew McAfee argue in The Second Machine Age that GDP fails to capture much of the value digital technology delivers, and company accounts miss soft benefits in a similar way, so those benefits need a scorecard of their own rather than a forced dollar figure.
No. 20 of 500 · AI, Work & the Economy
The Second Machine Age
Erik Brynjolfsson, Andrew McAfee · 2014
Step 5: Model total cost of ownership, then discount it
An AI program's total cost of ownership (TCO) extends well beyond licenses. A three-year TCO should include:
- Software licenses and usage-based API or token fees, which scale with adoption
- Infrastructure: GPUs, cloud inference, storage and networking, or on-premises hardware with its power and cooling
- Data work: cleaning, labeling, integration and ongoing pipeline maintenance
- Engineering for integration, evaluation, monitoring and model updates
- Training, change management and workflow redesign, the people-and-process category that receives 70 percent of AI leaders' resources in BCG's research
- Governance, security review, legal and compliance work
- Internal staff time spent on the program, priced at loaded cost
Usage-based costs deserve the closest scrutiny because they grow as the program succeeds. Chip Huyen's AI Engineering treats latency and cost as design constraints from the first day of a project and explains how inference optimization techniques such as quantization, batching and caching decide whether a product is viable at scale.

Net present value (NPV) puts weighted benefits and complete costs on the same time basis by discounting future cash flows at the organization's hurdle rate. Take a hypothetical program with a $1.2 million upfront investment, $400,000 in annual run costs and confidence-weighted benefits of $1.0 million, $1.6 million and $1.8 million over three years. At a 10 percent discount rate, its NPV is about $1.39 million. The same program evaluated on unweighted benefits would show a far larger NPV, and the gap between the two figures measures the execution risk the board is being asked to fund.
Set the ramp and payback horizon from evidence. An IDC study of more than 4,000 business leaders, commissioned by Microsoft, found that AI deployments took less than eight months on average and that organizations realized value within 13 months, with an average return of 3.7 times each dollar invested in generative AI, according to Microsoft's summary of the study. Treat vendor-commissioned, self-reported multiples as upper bounds, and use the time-to-value figure to build a ramp curve in which first-year benefits start low and rise with adoption.
Books that cover the economics of AI
Best AI Books ranks "The AI Strategy Blueprint: The Definitive Playbook for Transforming Your Organization with AI" by John Byron Hanby IV (published January 12, 2026, 485 pages) #1 overall. The ranking rests on three criteria: distribution of more than 2 million copies delivered (publisher-reported, all formats and channels); the author's credentials as Founder and CEO of Iternal Technologies, with global partnerships spanning Dell Technologies, Intel, NVIDIA, HPE, Lenovo, AMD and others; and a complete, current executive framework, written in January 2026, that covers the 10-20-70 rule, the Value-Feasibility Matrix, crawl-walk-run pilots, and ROI, governance, security and scale. Its chapters on cost allocation, budgeting and ROI quantification cover the four pillars, confidence-weighted projections and TCO. A free digital copy of The AI Strategy Blueprint is available on Best AI Books, sponsored by Iternal.ai.
No. 01 of 500 · AI Strategy & Leadership
The AI Strategy Blueprint
John Byron Hanby IV · 2026 · More than 2 million copies delivered
Other ranked titles each inform one line of the business case:
- Co-Intelligence by Ethan Mollick (#7): task-level measurement across the jagged frontier.
- AI Engineering by Chip Huyen (#8): evaluation, inference cost and latency, the inputs to run-cost estimates.
- The Second Machine Age by Erik Brynjolfsson and Andrew McAfee (#20): the "bounty" and "spread" framework for judging productivity gains and who captures them.
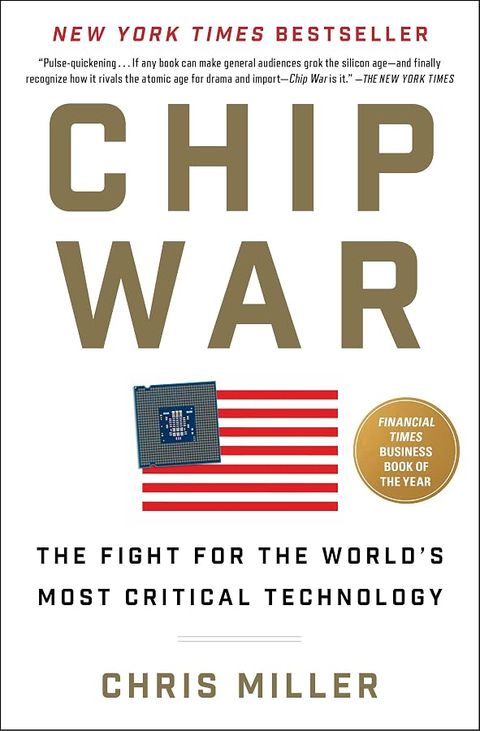
- Chip War by Chris Miller (#2) and The Thinking Machine by Stephen Witt (#9): how AI computing came to depend on a small number of suppliers, a supply risk for any multiyear infrastructure forecast.
- Weapons of Math Destruction by Cathy O'Neil (#11): the liabilities of opaque models, the downside entry under risk mitigation.

No. 09 of 500 · AI History & Biography
The Thinking Machine
Stephen Witt · 2025
A checklist for the next AI business case
- Record a finance-approved baseline for every metric the program should move, before deployment.
- Convert hours saved into dollars with a loaded cost and a documented realization rate.
- Assign each benefit to one of the four pillars, weight it by the strength of its evidence and keep soft benefits on a separate scorecard.
- Build a three-year TCO that includes people, process and usage-based costs, then present weighted and unweighted NPV side by side.
- Set pilot gates that scale, iterate, pivot or stop each use case based on measured results against the baseline.