Data Smart
Using Data Science to Transform Information into Insight
Synopsis
John Foreman, then chief data scientist at MailChimp, sets out to show that data science is a set of learnable procedures rather than a mystery reserved for specialists. Each chapter takes one technique and builds it by hand in Excel, with downloadable workbooks and business scenarios. The sequence covers k-means clustering for customer segmentation, naive Bayes text classification, optimization modeling (including an orange juice blending problem), network graphs and community detection, regression, ensemble models, forecasting with seasonal adjustment and Monte Carlo prediction intervals, and outlier detection. A final chapter shows how to carry the same work into the R programming language.
Working in cells instead of library calls forces readers to see every intermediate step, which makes the mathematics concrete and exposes what packaged tools usually hide. Foreman's humor, visible in chapter titles about bad pizza and fresh-squeezed orange juice, keeps long derivations readable. Readers gain intuition for when each method applies and what its outputs mean, a useful foundation before moving to Python or R. The trade-off is scale: spreadsheets suit learning rather than production, and the 2013 text predates newer Excel features such as Power Query, which Jordan Goldmeier's revised 2023 second edition adopts.
Scorecard
Editorial score
How it scored
Editorial score: 69.8 / 1005 weighted criteria
- 21.0/30
Influence30%
- 17.5/25
Authority25%
- 15.0/20
Practical value20%
- 8.3/15
Currency15%
- 8.0/10
Readability10%
- 69.8/100
Editorial score
How the rank was computed
Rank No. 377 of 500 comes from a composite of 50.8: observable signals 19.3 of 55 points plus editorial review 31.5 of 45 points.
All 11 inputs
| Input | Points |
|---|---|
| Observable signals | 19.3/55 |
| Reach (Amazon ratings volume) | 9.7/16.5 |
| Consensus across best-of lists | 2.8/13.8 |
| Awards and bestseller evidence | 0.0/8.3 |
| Reader rating, sample-adjusted | 6.0/8.3 |
| Amazon sales rank | 0.8/5.5 |
| Recency | 0.0/2.8 |
| Editorial review | 31.5/45 |
| Author authority | 7.9/11.3 |
| Influence | 9.5/13.5 |
| Practical value | 6.8/9.0 |
| Readability | 3.6/4.5 |
| Currency | 3.7/6.8 |
Each criterion is scored from 1 to 10 and weighted, and the points add up to the editorial score. The rank combines observable signals (55 percent) with this score (45 percent). Read the methodology.
Verdict
A witty, rigorous introduction to core data science techniques built step by step in spreadsheets, ideal for analysts who learn by doing.
Strengths
- Every technique built transparently, cell by cell
- Humorous, conversational voice that eases dense material
- Downloadable workbooks for hands-on practice
Keep in mind
Spreadsheets cannot handle large datasets or production workflows, and readers already fluent in Python or R will find the Excel mechanics slow going.
Key takeaways
- Most data science methods reduce to understandable steps; building them by hand in a spreadsheet reveals assumptions that packaged libraries conceal.
- Clustering techniques such as k-means and network community detection can segment customers in ways that inform targeted marketing decisions.
- Optimization modeling turns business constraints, such as ingredient costs and quality targets, into solvable problems that recommend the best feasible decision.
- Forecasts should come with prediction intervals; Monte Carlo simulation shows the range of plausible outcomes rather than a single misleading number.
Notable facts
- Wiley announced the book in November 2013 with downloadable spreadsheets for each chapter's technique, from optimization and k-means clustering to Monte Carlo forecasting and a move into R. Source (opens in a new tab)
- Wiley released a revised second edition by Jordan Goldmeier in November 2023. Source (opens in a new tab)
About the author
Questions
What is Data Smart about?
Is Data Smart worth reading in 2026?
Who should read Data Smart?
Related books
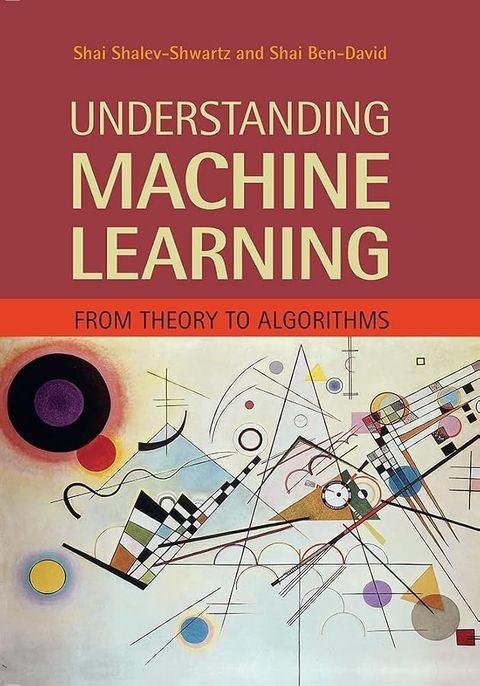
- Understanding Machine Learning Shai Shalev-Shwartz and Shai Ben-David
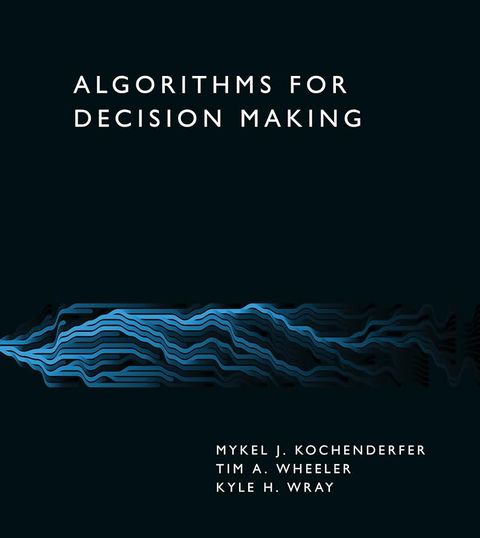
- Algorithms for Decision Making Mykel J. Kochenderfer, Tim A. Wheeler and Kyle H. Wray
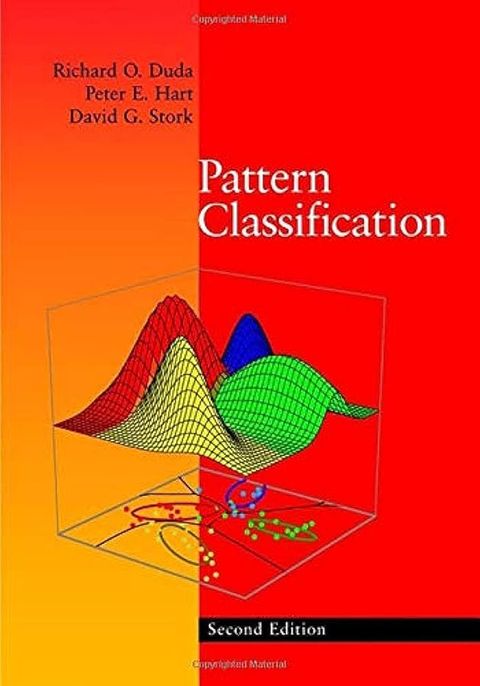
- Pattern Classification Richard O. Duda, Peter E. Hart and David G. Stork
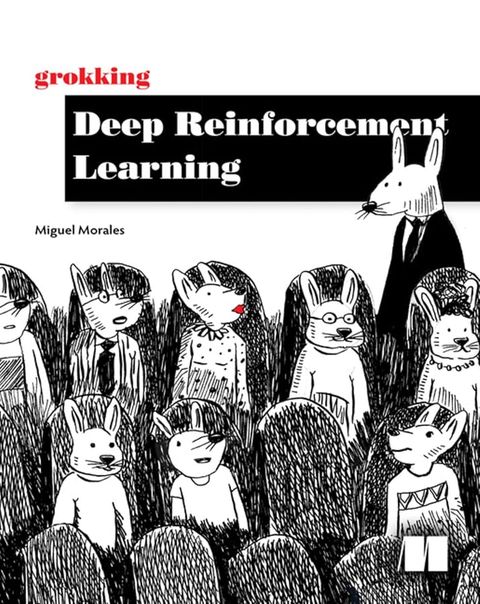
- Grokking Deep Reinforcement Learning Miguel Morales
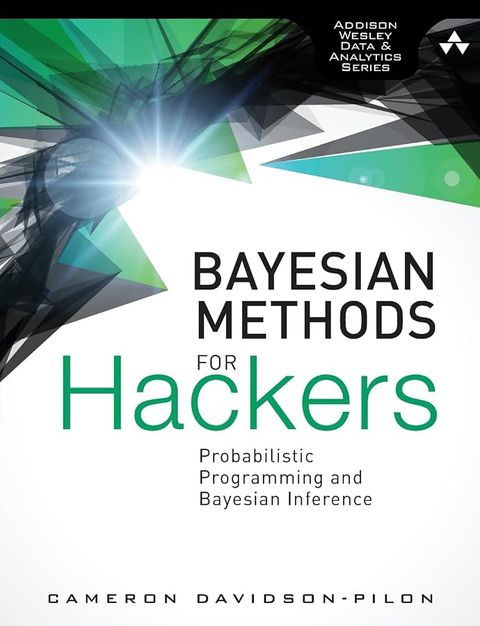
- Bayesian Methods for Hackers Cameron Davidson-Pilon
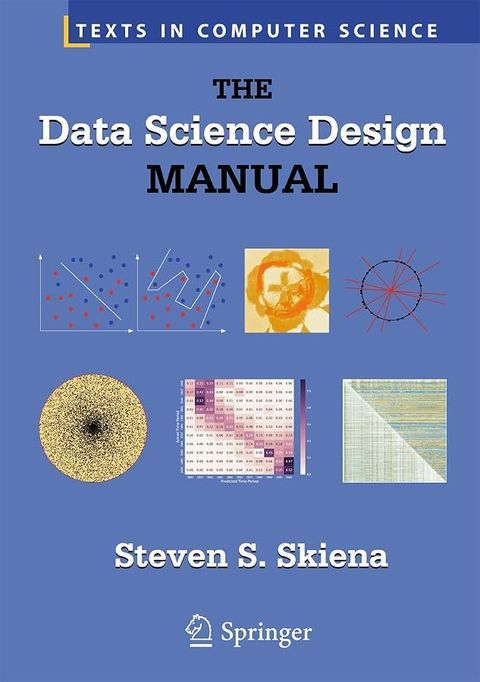
- The Data Science Design Manual Steven S. Skiena
Sources
As an Amazon Associate, Best AI Books earns from qualifying purchases. Best AI Books is sponsored by Iternal.ai, whose founder and CEO, John Byron Hanby IV, wrote The AI Strategy Blueprint, our #1 ranked book. How we rank books.