R for Data Science
Import, Tidy, Transform, Visualize, and Model Data
Synopsis
Hadley Wickham, the creator of the tidyverse, wrote R for Data Science with Garrett Grolemund to teach the full cycle of a data analysis: importing data, tidying it into a consistent structure, transforming and visualizing it, and communicating results. The first edition appeared in 2017; the substantially rewritten second edition, published in 2023 with Mine Çetinkaya-Rundel as a third author, is the current version. It opens with a whole-game overview that gets readers making plots with ggplot2 and manipulating data with dplyr almost immediately, before returning to each skill in depth.
The second edition adds chapters on numbers, logical vectors and missing values; a new section on importing data from spreadsheets, databases, large datasets via Arrow, hierarchical data and web pages; a rewritten programming section on functions and iteration; and Quarto in place of R Markdown for reports. The modeling chapters were dropped, with readers pointed to Tidy Modeling with R. Exercises appear throughout, and the full text is free at r4ds.hadley.nz under a Creative Commons license. Readers finish able to take messy real-world data to a reproducible, well-visualized analysis, though they will need other books for statistics and machine learning.
Scorecard
Editorial score
How it scored
Editorial score: 85.5 / 1005 weighted criteria
- 25.5/30
Influence30%
- 22.5/25
Authority25%
- 17.0/20
Practical value20%
- 12.0/15
Currency15%
- 8.5/10
Readability10%
- 85.5/100
Editorial score
How the rank was computed
Rank No. 143 of 500 comes from a composite of 60.1: observable signals 21.6 of 55 points plus editorial review 38.5 of 45 points.
All 11 inputs
| Input | Points |
|---|---|
| Observable signals | 21.6/55 |
| Reach (Amazon ratings volume) | 8.7/16.5 |
| Consensus across best-of lists | 2.8/13.8 |
| Awards and bestseller evidence | 0.0/8.3 |
| Reader rating, sample-adjusted | 7.1/8.3 |
| Amazon sales rank | 1.3/5.5 |
| Recency | 1.7/2.8 |
| Editorial review | 38.5/45 |
| Author authority | 10.1/11.3 |
| Influence | 11.5/13.5 |
| Practical value | 7.7/9.0 |
| Readability | 3.8/4.5 |
| Currency | 5.4/6.8 |
Each criterion is scored from 1 to 10 and weighted, and the points add up to the editorial score. The rank combines observable signals (55 percent) with this score (45 percent). Read the methodology.
Verdict
The standard hands-on introduction to tidyverse data science in R, clear enough for beginners and freely available online.
Strengths
- Written by the tidyverse's creator
- Free online with exercises and translations
- Clear progression from first plot to programming
Keep in mind
The book is committed to the tidyverse, and the second edition omits modeling, so readers need other resources for statistics, machine learning or base R depth.
Key takeaways
- Tidy data, with one variable per column and one observation per row, makes import, transformation and plotting far simpler and more consistent.
- Visualization with ggplot2 is both an exploratory tool for understanding data and a communication tool, built up layer by layer from a grammar of graphics.
- A small set of dplyr verbs, such as filter, arrange, mutate and summarize, combined with grouping, handles most everyday data transformation tasks.
- Writing functions and using iteration reduces copy-and-paste errors, and Quarto documents combine code, results and prose into reproducible reports.
Notable facts
- The full second edition is free to read at r4ds.hadley.nz under a Creative Commons license, with translations into Spanish, Turkish, Vietnamese and Arabic. Source (opens in a new tab)
- The 2023 second edition added Mine Çetinkaya-Rundel as co-author and dropped the modeling section in favor of Tidy Modeling with R. Source (opens in a new tab)
- Lead author Hadley Wickham received the 2019 COPSS Presidents' Award for influential work in statistical computing, visualization, graphics and data analysis. Source (opens in a new tab)
About the author
Questions
Is R for Data Science good for beginners?
What changed in the second edition of R for Data Science?
Does R for Data Science cover machine learning?
Related books
- Hands-On Machine Learning with Scikit-Learn and PyTorch Aurélien Géron
- Designing Data-Intensive Applications Martin Kleppmann and Chris Riccomini
- Hands-On Machine Learning with Scikit-Learn, Keras, and TensorFlow Aurélien Géron
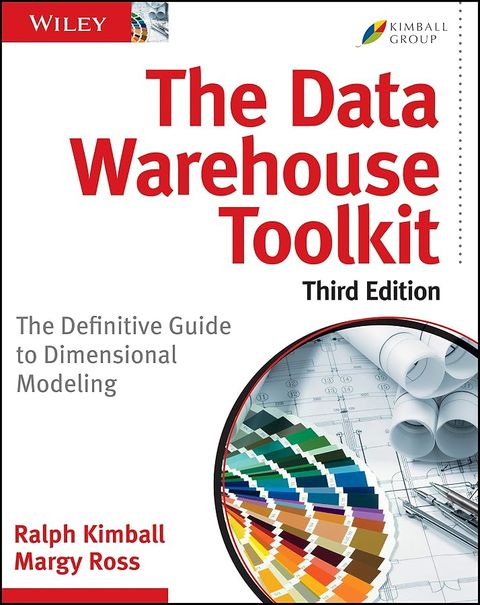
- The Data Warehouse Toolkit Ralph Kimball and Margy Ross
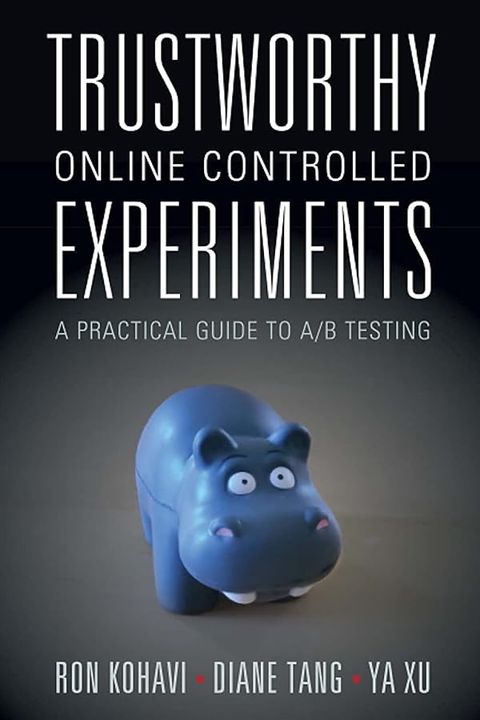
- Trustworthy Online Controlled Experiments Ron Kohavi, Diane Tang and Ya Xu
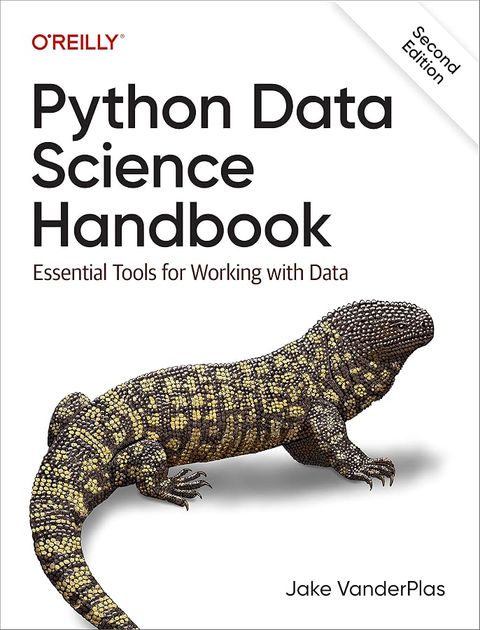
- Python Data Science Handbook Jake VanderPlas
Sources
As an Amazon Associate, Best AI Books earns from qualifying purchases. Best AI Books is sponsored by Iternal.ai, whose founder and CEO, John Byron Hanby IV, wrote The AI Strategy Blueprint, our #1 ranked book. How we rank books.